
Most tutors track income in their heads or in a spreadsheet — until they don't. TeachersFlow has built-in analytics that show your revenue, lesson stats, and trends without manual tracking.
Here's what's available and how to read the numbers.
The Dashboard
When you open TeachersFlow, the dashboard shows four metrics for the current month:
| Metric | What It Means |
|---|---|
| Active Students | Students who had lessons this month |
| Lessons This Month | All lessons in the current month (any status) |
| This Month's Income | Sum of completed lessons × lesson price |
| Pending Payments | Payments with pending status |
Below the metrics on the left — Today's Schedule: every lesson for today with time, student name, and status.
On the right — Recent Activity: students with a negative balance (who owe you money) flagged with an alert. If you're on a trial, this card also shows how many days remain.
This is your daily overview. For deeper analysis, go to Stats.
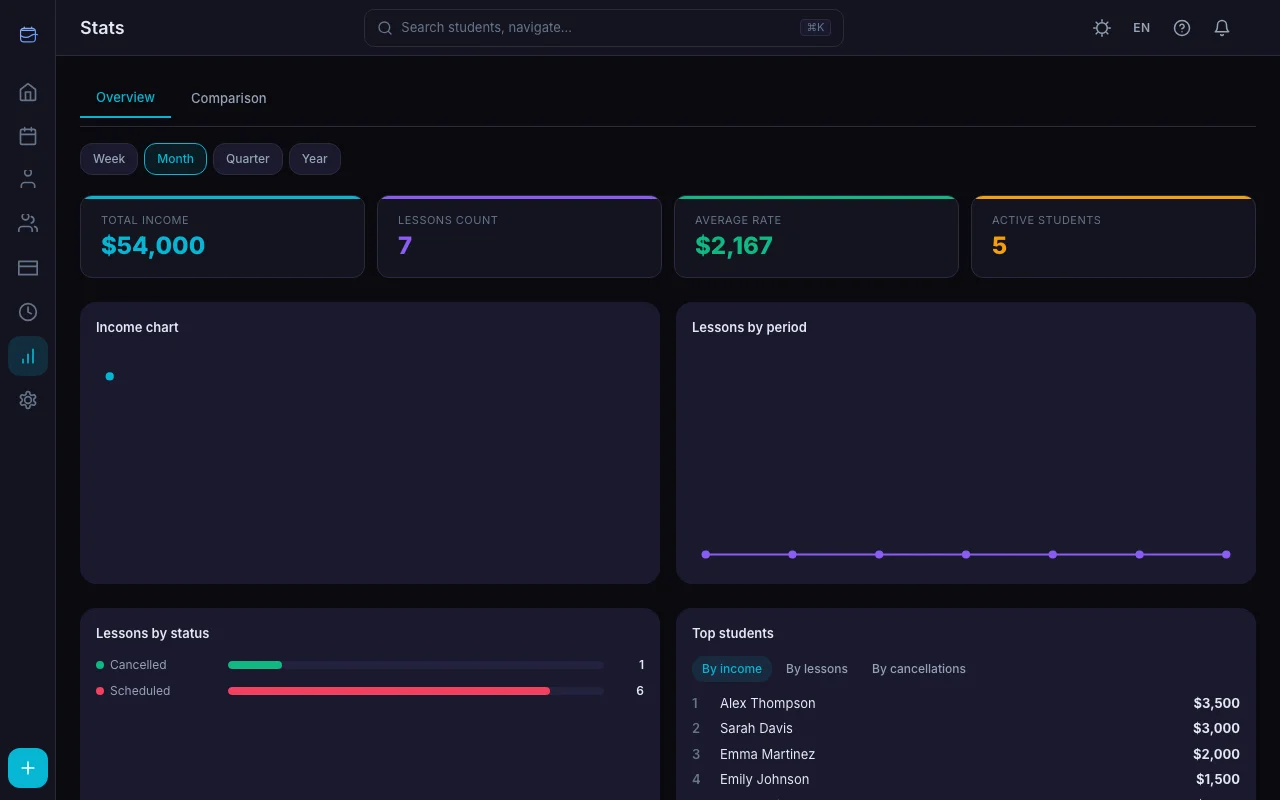
Stats: Overview
The Stats tab gives you detailed analytics. It's split into two tabs: Overview and Comparison.
Period Presets
| Period | Access |
|---|---|
| Week | Free |
| Month | Free |
| Quarter | Starter+ |
| Year | Pro |
The free plan shows data up to 30 days back. Starter extends to 90 days, Pro has no limit.
Six Key Metrics
At the top of the screen, six cards give you the big picture:
Total Income — sum of confirmed payments in the selected period. This is the money you actually received (cash in).
Lessons Count — all lessons in the selected period (completed, cancelled, scheduled).
Average Rate — your earned income divided by total teaching hours. If you earned $900 from 30 hours of lessons, your average rate is $30/hour.
Active Students — unique students who had at least one lesson in the period.
Cancellation Rate — percentage of lessons that were cancelled. Shows how stable your schedule is.
Paid Rate — percentage of completed lessons that have been paid. Below the number, the exact ratio is shown (e.g., "18 / 20").
Charts
Income by Month — a line chart with area fill. Shows how your revenue changes month over month.
Lessons by Weekday — shows which days of the week are busiest. Useful for spotting gaps where you could add more students.
Lessons by Status — horizontal bars showing the split between completed, cancelled, and scheduled lessons. High cancellation rates jump out immediately.
Paid and Unpaid Lessons
Below the status bars, a breakdown of completed lessons into paid and unpaid makes it easy to see how many lessons are still awaiting payment.
Debtors
The Debtors section shows up to 5 students with a negative balance. For each one, you see the name and current balance (negative amount). Clicking a row navigates to the student's card. If all balances are clear, the section shows a checkmark.
Top Students (Pro)
Available with Pro plan. Three tabs show your top 5 students by: - Income — who generates the most revenue - Lessons — who has the most lessons - Cancellations — who cancels most often
Tag Filtering (Pro)
If you organize students by tags (e.g., "SAT Prep", "English", "Beginners"), you can filter all analytics by a specific tag. Every metric, chart, and card recalculates for only the students with that tag.
Advanced Analytics: Starter
On the Starter plan, three additional cards appear:
Schedule Execution — a circular gauge (%) showing how many planned lessons actually happened. Plus mini stats: slots planned, lessons completed, reschedules and exceptions.
Payment Delay — average number of days between a lesson and its payment. Four tiers: same day, 1–3 days, 4–7 days, more than 7. Instantly shows if students are slow to pay.
Workload by Day — horizontal bars by weekday. The busiest day is marked with a star. Days with high load are highlighted.
Advanced Analytics: Pro
The Pro plan adds four more cards:
Student Retention — a cohort table. Each row is a group of students who started in a particular month. Columns show the percentage still active after 1, 2, 3 months, and so on. Cells are color-coded: green (≥80%), yellow (≥50%), red (<50%).
Invite Funnel — three stages: invitations sent → accepted → first lesson completed. Shows your conversion from invite to actual student.
Income by Type — how much you earn from individual vs. group lessons. A stacked bar chart with amounts and percentages.
Student Reliability — top 10 students by attendance rate. Shows the name, lessons completed out of total, and a percentage. Badges: ≥90% green, ≥70% yellow, <70% red.
Period Comparison (Pro)
The Comparison tab lets you compare two time periods side by side.
Presets
- Last 7 days vs. previous 7 days
- Last 30 days vs. previous 30 days
- This month vs. last month
- This quarter vs. last quarter
- This year vs. last year
- Custom dates (any two periods)
Main Comparison Metrics
Each metric shows the value for both periods, a "was" label, and a percentage change:
| Metric | What It Tells You |
|---|---|
| Completed lessons | Are you teaching more or less? |
| Cancelled lessons | Is your cancellation rate improving? |
| Accrued income | Revenue from completed lessons (calculated) |
| Received income | Actual money in (confirmed payments) |
| Total hours | Your workload trend |
| Income per hour | Are you earning more efficiently? |
A green arrow means improvement, red means decline. For cancellations, the colors are inverted — fewer cancellations show as green.
Extra Metrics
Below the main six, four additional indicators appear: active students, paid lessons, unpaid lessons, and cancellation rate. They fill in the gaps for a more complete picture.
Verdict
TeachersFlow automatically summarizes which period was better across the majority of metrics. It's the quick answer to "am I doing better or worse?" without manual analysis.
Comparison Charts
Three charts visualize the differences:
- Income by Month — two lines (period A and period B) on one chart
- Lessons by Weekday — grouped bars for both periods
- Income by Type — stacked bars (individual vs. group) for both periods
Exporting Reports
You can download your income data as a file — useful for tax filings, sharing with students, or archiving.
Go to Settings → Subscription and use the download buttons at the bottom of the page:
| Format | Plan |
|---|---|
| CSV | Starter+ |
| Pro |
Both formats cover income for the current month. CSV opens in Excel or Google Sheets for further analysis. PDF is a ready-to-print document.
Income: Accrued vs. Received
TeachersFlow tracks two different revenue numbers:
Accrued income = sum of (lesson price × completed lessons). This is what you've earned by teaching.
Received income (Cash in) = sum of confirmed payments from students. This is what actually came in.
The difference matters. If a student has lessons but hasn't paid yet, accrued income is higher than received. If a student prepaid for the whole month but only had two lessons so far, received is higher than accrued.
Both numbers are useful: - Accrued tells you how much value you created - Received tells you how much cash you have
Practical Use Cases
"Am I earning more than last month?"
Go to Stats → Comparison → This month vs. last month. Check the "Received income" delta. Or check the verdict — it tells you right away.
"Which students are most valuable?"
Stats → Overview → Top Students → By Income. If 80% of your income comes from 3 students, you know where your revenue concentrates.
"Why did my income drop?"
Stats → Overview → Lessons by Status. If completed lessons stayed the same but cancellations increased, students are cancelling more — read Stop Losing Money on Lesson Cancellations. If total lessons dropped, you lost students or reduced hours. Check the Student Retention card (Pro) — maybe students are leaving after 1–2 months.
"What's my real hourly rate?"
Stats → Overview → Average Rate. This is income ÷ total teaching time, accounting for different lesson durations and prices.
"When should I take on new students?"
Stats → Overview → Workload by Day. Days with low load are where new students fit. The busiest day is marked with a star.
"Who's behind on payments?"
Stats → Overview → Debtors. The section immediately shows who has a negative balance. The Payment Delay card (Starter+) shows the average delay and which tier most students fall into. Then send a payment request or set up automated payment reminders.
"How do I convert invites into students?"
Stats → Overview → Invite Funnel (Pro). If 20 invitations resulted in only 2 first lessons, it's worth rethinking your approach — start with How to Invite Students to TeachersFlow.
"Are my invitations converting?"
Stats → Overview → Invite Funnel (Pro). If out of 20 invitations only 2 turned into real students, it's time to rethink the approach.
Tips
Check weekly. Spend 2 minutes on Monday looking at last week's stats. Catching trends early (dropping lesson counts, rising cancellations) lets you act fast.
Compare quarters, not weeks. Week-to-week variation is normal (holidays, illness). Quarter-over-quarter shows the real trend.
Use Top Students to spot risks. If one student accounts for 40% of your income, losing them would be a crisis. Diversify.
Watch retention. The cohort table (Pro) shows whether new students are dropping off after a month. If there are too many red cells, the problem isn't acquisition — it's retention.
Use tags for segmentation. If you teach different subjects or levels, assign tags and view analytics for each segment separately.
Start Tracking
Open TeachersFlow and check your Stats tab. Every lesson and payment is already tracked — just read the dashboard.
14 days of full Pro access — no card required.